Understanding Our Short Portfolio Strategies
Our Short Portfolio consists of multiple distinct strategies designed to identify and capitalize on downward price movements in the Nasdaq-100 futures market (commonly known as "NQ futures"). Each strategy operates within a specific timeframe but shares our core philosophy of systematic, rules-based trading enhanced by machine learning technology.
These strategies are all intraday, meaning positions are opened and closed within the same trading day, avoiding overnight market exposure and associated risks. By utilizing multiple timeframes, our portfolio aims to capture upside opportunities across various market conditions.
Strategy Performance
The strategy backtest results assumes trading 1 NQ contract with comissions and slippage included
Click the buttons below to view detailed backtest results for our Short Portfolio. Each report includes standard performance metrics that help evaluate strategy effectiveness.
Annual Return
$266,476
Average yearly profit
Profit Factor
4.1
Gross profit / gross loss
Win Rate
73.37%
901 winners / 1,228 trades
Max Drawdown
5.43%
$13,375 peak to trough
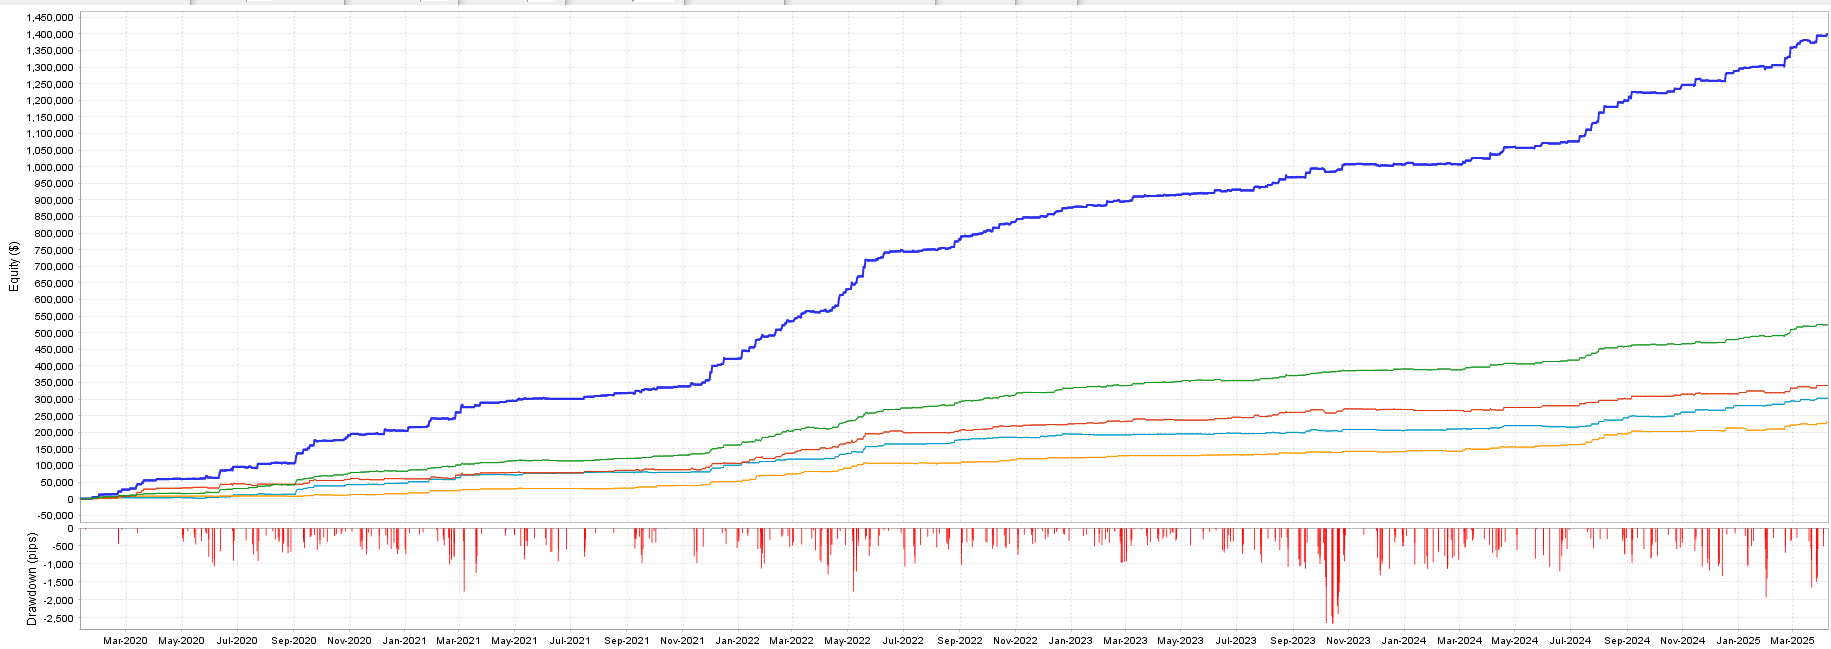
Performance Visualization
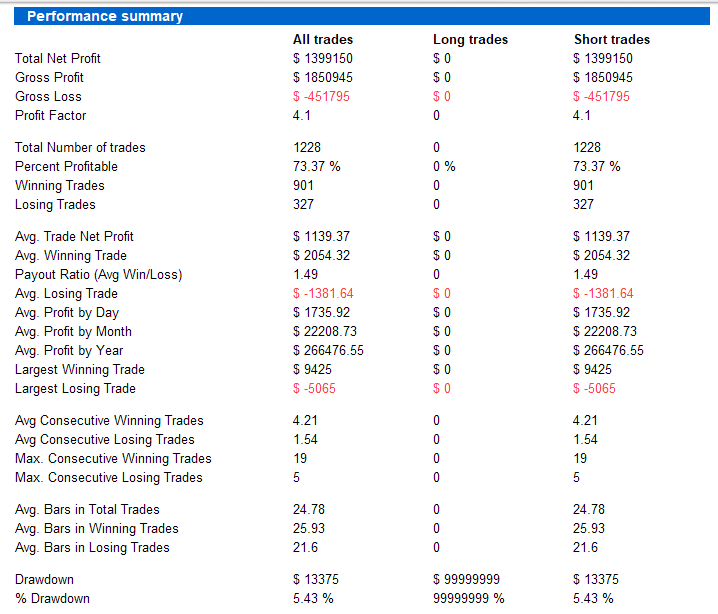
Comprehensive Performance Metrics
| Profitability Metrics | |
|---|---|
| Total Net Profit | $1,399,150 |
| Gross Profit | $1,850,945 |
| Gross Loss | $451,795 |
| Daily Average Profit | $1,735.92 |
| Monthly Average Profit | $22,208.73 |
| Trade Statistics | |
| Average Trade Net Profit | $1,139.37 |
| Average Winning Trade | $2,054.32 |
| Average Losing Trade | $1,381.64 |
| Reward/Risk Ratio (Avg Win/Loss) | 1.49 |
| Largest Winning Trade | $9,425 |
| Largest Losing Trade | $5,065 |
| Consistency Metrics | |
| Average Consecutive Winning Trades | 4.21 |
| Average Consecutive Losing Trades | 1.54 |
| Maximum Consecutive Winning Trades | 19 |
| Maximum Consecutive Losing Trades | 5 |
| Average Bars in Winning Trades | 25.93 |
| Average Bars in Losing Trades | 21.6 |
Investment Growth Example
$100,000 → $1,399,150
If you had invested $100,000 in this Short Portfolio strategy in January 2020, it would have grown to approximately $1,399,150 by March 2025.
- That's a 13.99x return on your initial investment over 5.25 years
- Equivalent to approximately 69.1% compound annual growth rate
- Your investment would have experienced a maximum drawdown of only $5,430 (5.43% of initial capital)
- The strategy performed especially well during market downturns, with 2022 being the best year (454.67% return)
Note: Past performance is not indicative of future results. All trading involves risk of loss.
1,399% Total Return
Yearly Returns: Short Strategy vs. NQ Benchmark
| Year | Strategy Return (%) | NQ Return (%) | Outperformance (%) | $100K in Strategy | $100K in NQ |
|---|---|---|---|---|---|
| 2020 | 204.64% | 47.58% | +157.06% | $304,640 | $147,580 |
| 2021 | 217.60% | 26.63% | +190.97% | $317,600 | $126,630 |
| 2022 | 454.67% | -32.97% | +487.64% | $554,670 | $67,030 |
| 2023 | 129.48% | 53.81% | +75.67% | $229,480 | $153,810 |
| 2024 | 283.13% | 24.88% | +258.25% | $383,130 | $124,880 |
| 2025 (Q1) | 109.65% | -10.38% | +120.03% | $209,650 | $89,620 |
| Cumulative | 1,399.15% | 109.55% | +1,289.60% | $1,499,150 | $209,550 |
Monthly Performance Heatmap ($)
| Year | Jan | Feb | Mar | Apr | May | Jun | Jul | Aug | Sep | Oct | Nov | Dec | YTD |
|---|---|---|---|---|---|---|---|---|---|---|---|---|---|
| 2025 | 9,740 | 59,650 | 35,995 | 4,260 | 0 | 0 | 0 | 0 | 0 | 0 | 0 | 0 | 109,645 |
| 2024 | 570 | 345 | 17,445 | 35,210 | 11,765 | 4,890 | 59,705 | 63,045 | 24,225 | 22,930 | 12,270 | 30,725 | 283,125 |
| 2023 | 7,270 | 11,085 | 16,620 | 3,690 | 5,340 | 10,220 | 7,875 | 29,410 | 25,070 | 14,175 | 750 | -2,025 | 129,480 |
| 2022 | 66,300 | 45,895 | 29,070 | 69,105 | 87,170 | 26,445 | 4,520 | 32,165 | 25,255 | 26,535 | 16,295 | 25,825 | 454,670 |
| 2021 | 37,330 | 18,115 | 29,305 | 5,350 | 7,500 | -1,020 | 6,380 | 8,745 | 13,820 | 6,395 | 20,535 | 63,340 | 217,595 |
| 2020 | 12,520 | 14,925 | 27,945 | 3,545 | 5,305 | 31,710 | 8,995 | 1,955 | 67,190 | 16,770 | 6,990 | 7,115 | 204,635 |
Key Performance Insights
Strategy Highlights
- The Short Portfolio has significantly outperformed the NQ benchmark every year
- Most impressive outperformance was in 2022 (+487.64%), when NQ experienced a substantial decline
- Only 2 negative months across the entire 5+ year backtest period
- Extremely low maximum drawdown of just 5.43%
- High win rate of 73.37% with strong profit factor of 4.1
Growth Comparison
If you had invested $100,000 at the beginning of 2020:
Strategy Value
$1,399,150
NQ Benchmark Value
$209,550
Understanding how our backtests are conducted is crucial for proper interpretation of results:
- Historical data: Testing uses tick-by-tick historical NQ futures data
- Transaction costs: All results include realistic commission and slippage estimates
- Out-of-sample validation: Strategies are developed on training data and validated on separate testing data to reduce overfitting
- Risk management: All strategies incorporate strict risk management parameters
Short Strategy Specific Considerations
When interpreting our Short Portfolio backtest results, consider these additional factors:
- Borrowing costs: Results account for the costs associated with shorting futures contracts
- Volatility environments: Backtest period includes both low and high volatility market environments
- Market conditions: Testing period encompasses both bull and bear market phases to ensure strategy robustness
- Market crashes: The 2020 COVID crash and 2022 market correction are included in the backtest period, providing insight into performance during extreme market conditions